Back

Transforming complex production SAP and Excel data into clear, actionable interfaces for workers and managers.
The Context
The factory ran on manual logs and chaotic Excel sheets. Data was delayed, error rates were high, and developers stated the legacy SAP system was "too rigid" for modern UX.
SCOPE
Designed 30+ production interfaces (PODs) for 30,000+ factory operators and 40+ Power BI/SAP dashboards for supervisors.

What I Built & The Impact
Apps for Factory Workers (PODs & Jidoka PODs)


The Problem
Workers tracked data across paper logs, Excel sheets, and slow, fragmented legacy systems. This created a massive lag between physical production and digital records, delaying visibility and increasing the risk of human error.
The Solution
AI-Driven Forms (Jidoka)
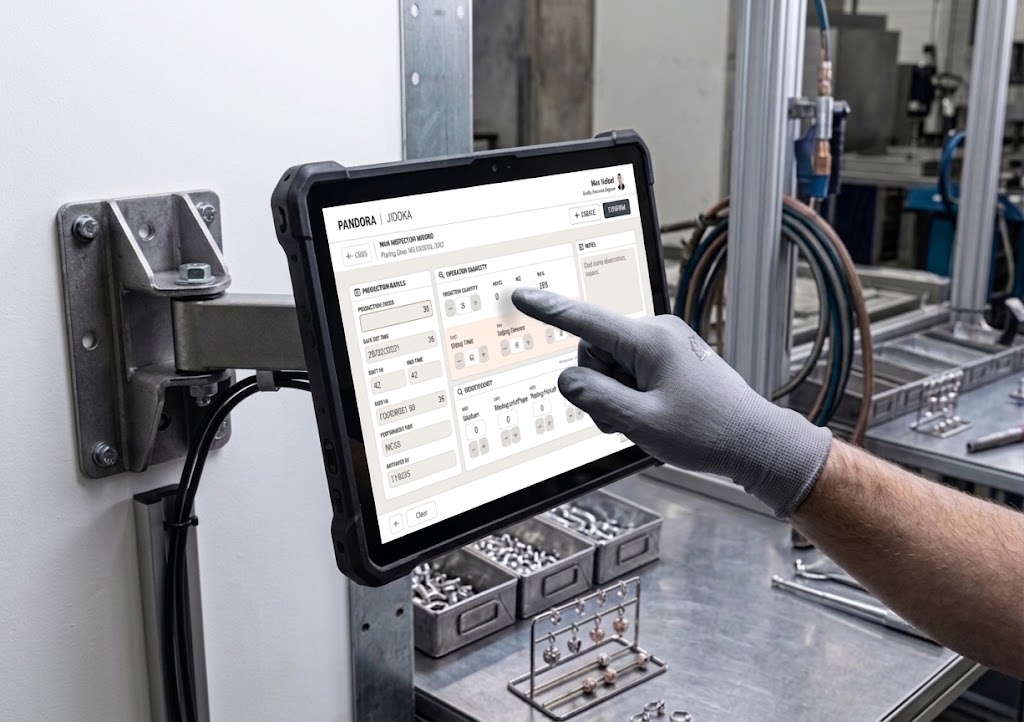
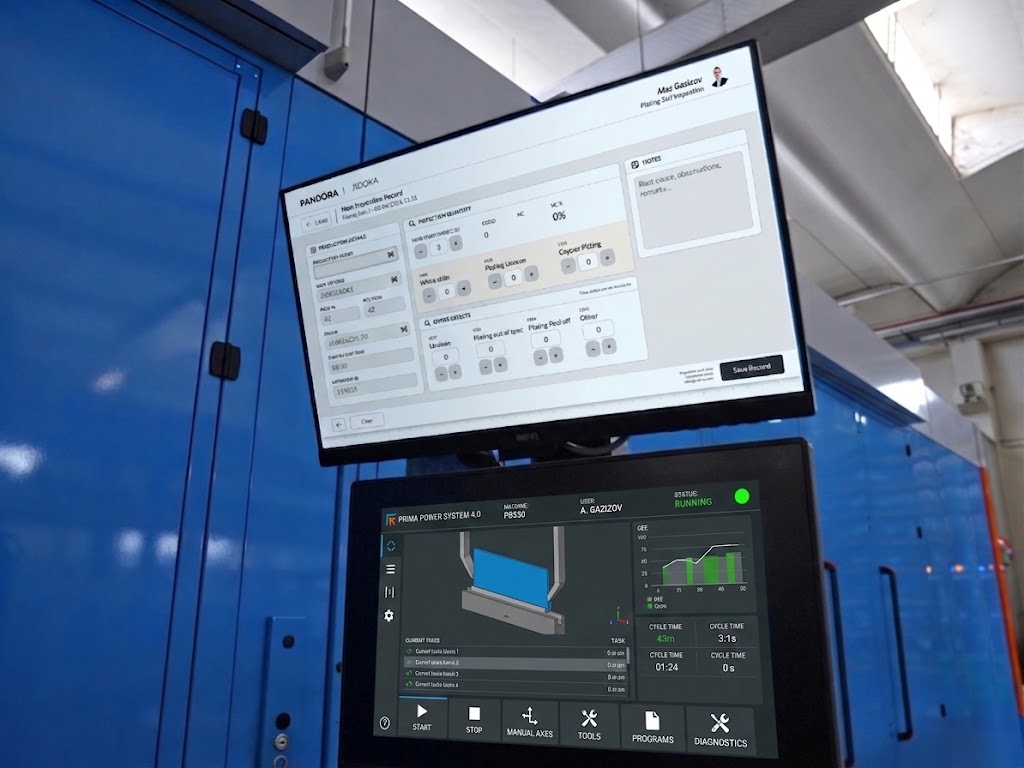
For quality control apps, I collected the most used fields and build smart forms used AI. The screen adapts to different situations, showing workers only what they need right then. This sped up data entry and stopped mistakes.
Strict Ergonomics (PODs)
Workers have thicker fingers and wear gloves, leading to accidental taps. Since you cannot easily "undo" an action in SAP, I limited screens to a maximum of 6 massive buttons per row. Less common tasks went into a "More" menu to prevent costly errors.
System Consistency
Standardized the architecture, design system across all 30+ PODs so operators switching between physical stations never experienced a learning curve.
Bypassing Tech Constraints
When developers cited SAP limitations as a blocker, I used Claude to build functional, working prototypes to prove the logic could be executed.
The Impact
With 30,000+ daily operators, saving just a few seconds per interaction compounded into massive time savings for the factory. We eliminated late-logging errors and established a real-time data pipeline.
Dashboards for Line Managers


The Problem
Without live data, supervisors couldn't spot bottlenecks, friction, or defects until it was too late. The original developer-built dashboards prioritized corporate brand colors over functional, operational usability.
The Solution
Data Hierarchy
Dug into the data to understand the actual drivers of factory efficiency. Balanced business requirements with user feedback to push non-critical metrics into the background.
Function Over Brand
Flipped the color strategy entirely. Efficiency, readability, and high contrast came first—branding came second. Managers required interfaces designed for split-second, high-stakes decisions.
Shipped Code
Used AI tools to code the entire frontend logic for supervisor forms directly inside SAP and Power Apps.
Business Impact & Scale

Massive Digital Shift
30,000+ workers moved from slow paper tracking to a 100% digital, real-time system.
Faster
Fixes
40+ dashboards were redesigned to help managers spot and fix problems instantly, reducing machine downtime.
Faster Development
By using AI to build prototypes and write frontend code, I massively cut down the time between design and final development.